The Real Cost of Underperforming Landing Pages
When a landing page underperforms, the consequences can ripple across your entire ecommerce operation. You may be pouring significant ad spend into platforms like Google Ads, Meta, or TikTok, driving what appears to be strong traffic, only to see a disappointing number of conversions. While it is tempting to attribute low performance to temporary factors like seasonality or minor copy issues, consistent underperformance usually signals a deeper problem that can drain resources and stall growth.
A landing page serves as a digital handshake. It is often the first impression a visitor has of your brand, and it plays a pivotal role in whether that visitor becomes a customer. If your page is not converting, the issue is not limited to missed sales. You are also likely dealing with a lower return on ad spend, a higher customer acquisition cost, and fewer data points for retargeting or lifecycle marketing. Over time, these problems compound, eroding your margins and weakening your marketing efficiency.
Conversion rate optimization (CRO) experts often stress the importance of knowing your benchmarks, but the truth is, even within industry ranges, the right conversion rate is highly contextual. A page converting at 3 percent might seem fine at first glance, but if the traffic is high-intent, well-segmented, and cost-intensive, that same figure might actually be underperforming. Conversely, a 1.5 percent conversion rate might be acceptable if the traffic is cold, the campaign is in its early testing phase, or the offer is high-ticket and requires more nurturing. The key is to evaluate performance within the broader ecosystem of acquisition cost, customer lifetime value, and user intent.
It is also important to consider what constitutes a meaningful drop. Occasional fluctuations are normal. A 10 to 15 percent swing in conversion rate from week to week may not signal an emergency, especially if traffic volume or channel mix shifts. However, if conversions decline steadily over a 2 to 4 week period, especially across multiple channels or audience segments, this often indicates structural issues. These could include poor alignment between ad creative and landing page messaging, confusing user experience, or an offer that no longer resonates with your target market.
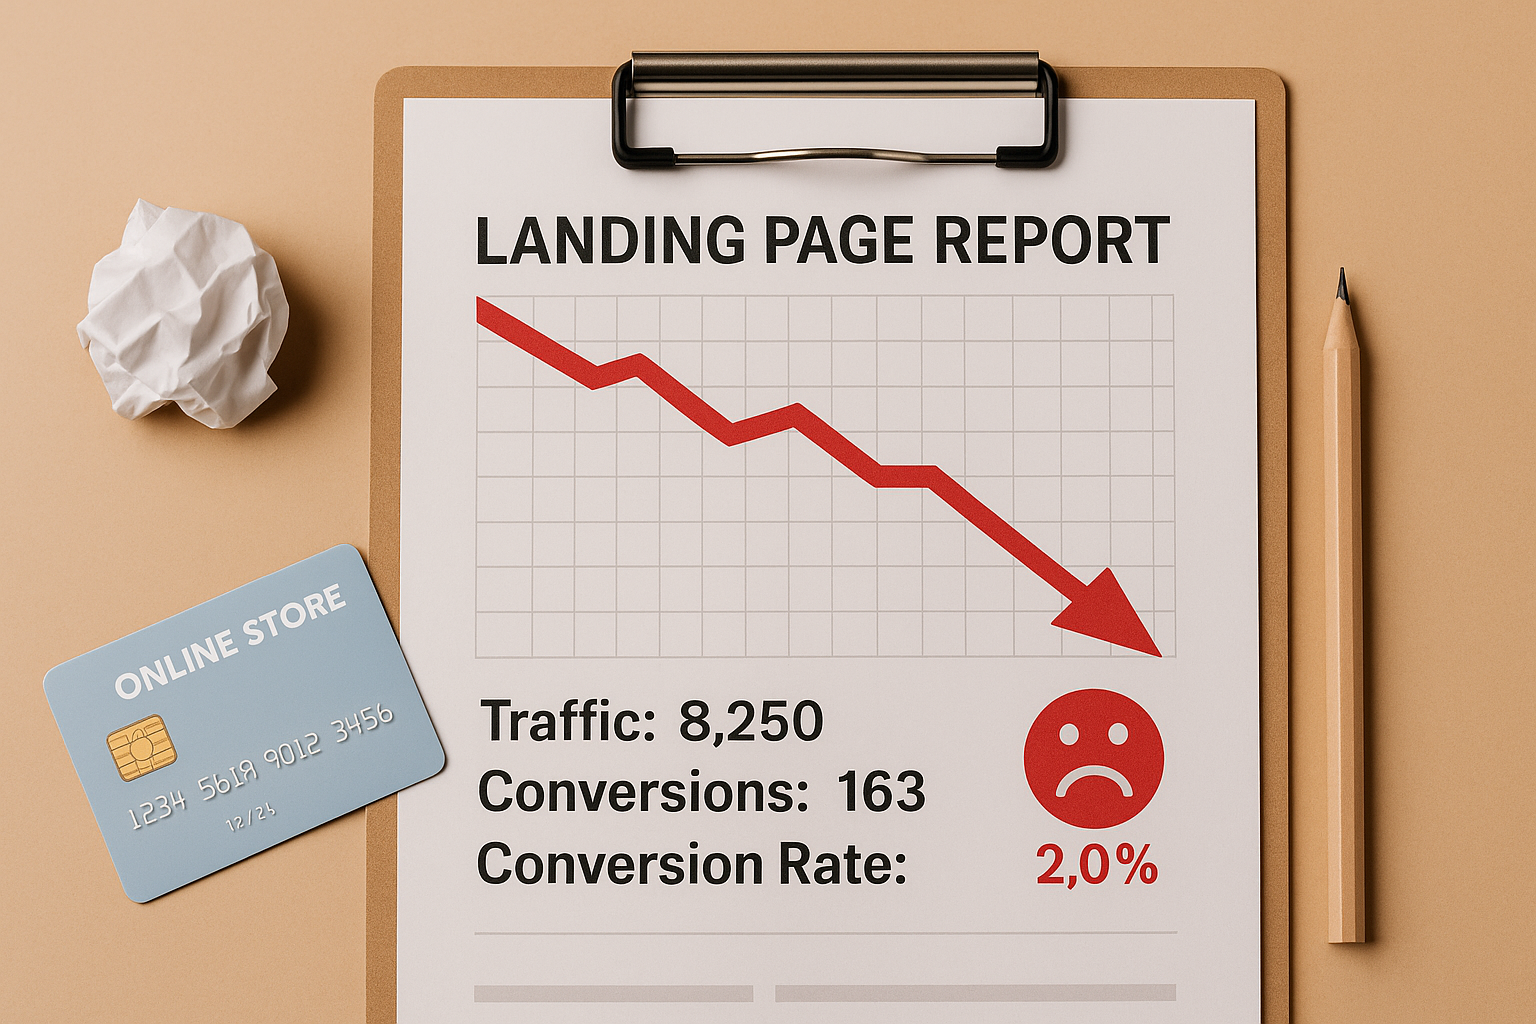
For brands focused on growth, ignoring these red flags can be a costly mistake. An ecommerce business spending $20,000 monthly on paid acquisition with a 2 percent conversion rate is generating 400 orders. If that rate drops to 1.5 percent, the business now sees only 300 orders for the same budget. That is a 25 percent decrease in revenue without any reduction in spend. Worse, the business might continue investing in traffic rather than addressing the core problem on the page itself.
Understanding when to be concerned about low landing page conversion is about more than just reacting to numbers. It requires interpreting signals within a larger strategic context. In the sections that follow, we will walk through key indicators, benchmarks, and diagnostic techniques to help you identify when your landing page performance is a passing slump or a genuine warning sign that demands action.
Industry Benchmarks: What Is Considered Low?
Not all landing page conversion rates are created equal. What might be considered low for one business model could be entirely acceptable for another. Understanding when to be concerned about a poor conversion rate starts with knowing the typical performance benchmarks in your industry and adjusting for your unique context.
In ecommerce, the average landing page conversion rate tends to fall between 1.5 percent and 3 percent. According to data from Unbounce’s Conversion Benchmark Report, ecommerce conversion rates often hover around 2 percent. However, this number varies widely depending on several factors, including product price point, source of traffic, and the nature of the landing page itself. For example, a high-ticket item like luxury furniture will naturally convert at a lower rate than a low-risk impulse buy like a phone accessory.
In the lead generation space, benchmarks tend to be higher. Pages designed to capture emails, signups, or form submissions typically see conversion rates between 4 percent and 10 percent, sometimes even higher in niche B2B verticals. This is partly because the commitment required is much lower. The visitor is not being asked to spend money, only to express interest. However, this also means that quality control becomes important. A high volume of low-quality leads can create downstream inefficiencies that offset the apparent success of the landing page.
For software-as-a-service (SaaS) companies, the benchmarks are more nuanced. A free trial or demo request page may convert anywhere from 3 percent to 8 percent, depending on the offer clarity, trust signals, and traffic intent. Pages aimed at enterprise buyers tend to convert lower but carry higher deal value. In these cases, low conversion rates can be acceptable as long as the pipeline quality remains strong.
It is also essential to distinguish between cold traffic and warm or returning users. A landing page that receives the majority of its traffic from cold ads on social media will naturally perform worse than one receiving direct or email traffic from people already familiar with the brand. If your business is investing heavily in paid acquisition, particularly on platforms like TikTok or Meta, even a 1 percent conversion rate can be viable as long as your customer lifetime value justifies the cost per acquisition.
Another important factor is device type. Mobile landing pages almost always convert lower than desktop pages. This is due to smaller screen sizes, navigation friction, and distracted browsing behavior. If your mobile conversion rate is under 1 percent but desktop is closer to 3 percent, this does not necessarily indicate failure. However, it does suggest room for optimization in mobile UX and load speed.
When evaluating whether your landing page conversion rate is low, do not rely on a single benchmark. Instead, analyze your numbers through multiple lenses: traffic intent, acquisition channel, device type, product complexity, and page type. A high-performing page for one brand could be a disaster for another depending on these variables.
Ultimately, the moment to be concerned is when your conversion rate falls significantly below both industry averages and your own historical performance, especially when your traffic quality remains consistent. If your metrics are consistently underperforming relative to these benchmarks, it is time to investigate deeper causes and take corrective action. A well-informed benchmark is not a hard limit, but it is a helpful warning system that tells you when further analysis is warranted.
Duration and Trend: Temporary Dip or Long-Term Decline?
A single day of poor landing page conversion does not necessarily signal a problem. Even high-performing campaigns can experience fluctuations based on factors outside of your control, such as news cycles, weather, competitor promotions, or shifts in consumer behavior. However, when a dip stretches over several days or begins to show a consistent downward pattern, it becomes much more than just a fluke. Understanding the duration and trend of your conversion rates is crucial to knowing when to intervene.
Short-term changes are common. A sudden drop over 24 to 48 hours might be explained by a traffic spike from an unqualified audience, a holiday weekend, or even a bug introduced during a recent website update. Before sounding the alarm, compare this data against the previous week, the same days in the prior month, and ideally the same time last year. Seasonality plays a significant role in ecommerce and lead generation, so context matters.
If your conversion rate has declined for more than seven consecutive days and shows no sign of rebounding, this is your first signal that the issue may not be temporary. When the trend continues over two to three weeks, especially across multiple landing pages or campaigns, it usually indicates a systemic problem that needs attention. In these cases, do not wait for a quarterly review. Act immediately to investigate the cause.
One way to visualize the severity of the drop is by using line charts in Google Analytics 4, Looker Studio, or any dashboard tool that allows you to overlay performance data over time. Look for downward slopes that persist regardless of traffic volume. If sessions stay stable or increase while conversion rates fall, the problem is likely on the landing page rather than in your acquisition funnel.
A consistent decline in conversion rate accompanied by a rising bounce rate or falling average session duration is especially concerning. This signals that not only are visitors failing to convert, but they are also disengaging from the content altogether. A sudden increase in exit rate on key pages is another strong indicator that something has changed, either in user expectations, page functionality, or offer clarity.
Campaign fatigue is also worth considering. Paid media campaigns can burn out quickly, especially if creative assets or targeting remain static. If your campaign has been running for several weeks without new creative or refreshed offers, performance often declines gradually. In these cases, the landing page might not be the only issue, but it still deserves a full review alongside your ad assets.
Another scenario involves website changes that are not properly documented or tested. A small visual adjustment, a JavaScript update, or a content swap made by another team can go unnoticed but have a large impact on user experience. Reviewing your version history, deployment logs, and any platform updates during the period of decline is critical for pinpointing these causes.
In summary, it is not just the presence of a dip that matters, but the consistency and trajectory of the decline. A short-term slump may pass without major consequence. A multi-week drop with no signs of recovery, on the other hand, is a clear warning that demands deeper analysis. Monitoring duration and trend protects you from reacting too quickly to noise, but also ensures you are not blind to signals that could indicate deeper conversion issues.
Traffic Quality and Intent Mismatch
A low landing page conversion rate is not always the result of a design flaw or broken element. Sometimes the problem begins before a user even arrives on the page. Traffic quality, visitor intent, and the way they align with your offer play a foundational role in whether someone will convert. If the wrong people are being sent to the right page, the conversion rate will suffer regardless of how well that page is built.
Every traffic source brings a different level of intent. Someone who searches for “best protein powder for runners” and clicks on a Google Search ad is likely in the research or buying stage. Compare that to someone scrolling through TikTok and clicking on a flashy video ad with no real shopping intent. Even if both users land on the same product page, the likelihood of conversion is dramatically different. This is why it is dangerous to evaluate landing page performance without accounting for where the traffic comes from.
The first step is to segment your landing page traffic by source, medium, and campaign. Tools like GA4, Meta Ads Manager, and UTM parameters make this possible with minimal setup. If your Google Ads traffic converts at 3 percent while your Instagram traffic converts at 0.5 percent, the issue may not lie with the landing page at all. Instead, the mismatch between creative expectations and the page content might be the real problem.
Intent mismatch often occurs when ad copy promises something different than what the landing page delivers. For example, a Facebook ad that promotes a “30-day free trial” but leads to a landing page pushing annual subscriptions can cause friction and confusion. The user expects one thing and gets another. This misalignment damages trust and can result in high bounce rates and low conversion rates, even if the page looks professional.
Audience targeting also plays a major role. If your traffic includes users who are too early in the buying journey or not even in your ideal demographic, you will see poor results. Paid campaigns with overly broad targeting, interest-based segments without qualification, or traffic driven by influencer links without context can flood your page with visitors who were never a good match for the offer. These visitors may engage briefly, scroll, and leave, driving your conversion rate down.
Another red flag is when traffic volume increases but conversions remain flat or decline. This often happens during periods of aggressive ad spending without corresponding refinements to targeting or messaging. If your budget increases but your conversion rate drops, it is worth investigating whether you are reaching the right people or simply reaching more people who are not ready to convert.
Additionally, affiliate and referral traffic can create problems if not managed properly. Partners may send users with varying levels of interest, and not all affiliate content accurately reflects the product or offer. If these pages become a significant portion of your inbound traffic, the misalignment can depress overall conversion rates.
To improve performance, align traffic intent with landing page content. Ensure that your ad copy, visuals, and targeting match the expectations you set. A well-designed page cannot rescue poor targeting or misleading messaging. Before optimizing the page itself, confirm that the people arriving there are genuinely interested in what you are offering.
UX and Technical Failures That Wreck Conversion
Even with high-quality traffic and an appealing offer, your landing page can still fail to convert if the user experience is broken or frustrating. Technical issues and poor UX decisions are among the most preventable causes of low conversion rates, yet they often go undetected for weeks or even months. If your page is loading slowly, malfunctioning on certain devices, or causing confusion in navigation, the likelihood of a visitor completing their journey drops sharply.
Page load speed is one of the most critical factors. Studies consistently show that a delay of just one to two seconds can significantly increase bounce rates. According to Google’s research, the probability of a user bouncing increases by 32 percent as page load time moves from one second to three seconds. When a page takes longer than five seconds to load, especially on mobile, users often abandon it before they even see your headline. To avoid this, tools like Google PageSpeed Insights and GTmetrix can help you identify performance bottlenecks and prioritize fixes.
Mobile optimization is another non-negotiable aspect of landing page design. In many ecommerce environments, over 70 percent of visitors now come from mobile devices. A page that looks polished on desktop may be difficult to use on a small screen. Buttons that are too small, forms that require excessive scrolling, or elements that overlap due to poor responsive design all contribute to user frustration. If your mobile conversion rate is significantly lower than your desktop rate, this is a clear sign that your mobile UX deserves immediate attention.
Browser and device compatibility issues can also undermine performance. A landing page may work flawlessly in Chrome on a MacBook but break in Safari on an iPhone. This is especially common when using advanced animations, custom JavaScript, or third-party plugins. You should regularly test your landing pages across multiple browsers and devices to catch rendering issues that could be driving users away silently.
Broken elements are a more obvious but equally harmful problem. If your add-to-cart button does not respond, if your checkout form does not validate correctly, or if your CTA scroll link leads to a blank section, users will abandon the process without hesitation. Unfortunately, these issues can go unnoticed for days if not monitored closely. Using tools like Microsoft Clarity or FullStory can help you detect rage clicks and abandonment behavior linked to specific interactions on your page.
Another area to review is your form design. Long or complex forms are known to depress conversion rates, especially if they ask for sensitive information too early in the funnel. If a user encounters validation errors that are hard to understand or fix, they are unlikely to try again. Use smart defaults, clear instructions, and progress indicators when possible. Keep forms short unless you have a compelling reason to ask for more upfront.
Lastly, trust-related UX elements also impact conversions. Missing SSL certificates, outdated security badges, broken images, or a lack of visible contact information can create a sense of risk. Users must feel confident in the credibility of your site. If something feels off, even subconsciously, they will exit rather than engage.
In short, a technically sound and user-friendly experience is the baseline for any landing page to succeed. Before assuming your offer or message is the problem, verify that your page works flawlessly across all devices and situations. A single technical misstep can sabotage even the most compelling value proposition.
Offer Relevance and Message Clarity
A landing page can look visually appealing and function without error, but if the offer is not compelling or the messaging is unclear, conversions will remain low. Many businesses overlook this fundamental truth and instead focus their attention on design tweaks or traffic volume. While design and traffic matter, your ability to communicate the right value, to the right audience, at the right time will always be the deciding factor in whether someone converts.
The first issue to examine is offer relevance. This refers to how well the product, service, or incentive matches the expectations and needs of the audience arriving on the page. If visitors do not find the offer valuable, they will not engage further. A disconnect often occurs when businesses use a one-size-fits-all offer across all traffic sources. For example, an email subscriber might respond well to a loyalty discount, while a first-time visitor from a paid ad campaign might need a more introductory incentive such as a free trial or a bundle deal.
A frequent mistake occurs when brands update their acquisition channels without revisiting the offer on the page. Let’s say your ad campaign now targets budget-conscious users, but your landing page still promotes a premium, full-price package with no alternative. In this case, the offer may no longer be relevant to your new traffic. The misalignment will result in low conversions, not because the product is bad, but because the messaging and positioning are off.
Beyond relevance, message clarity is just as critical. If a user lands on your page and cannot quickly understand what you are offering, why it matters, and what they should do next, you will lose them. You have only a few seconds to capture attention and create a connection. If your headline is vague, your subhead is packed with jargon, or your call to action lacks specificity, visitors will hesitate or bounce entirely.
Strong message clarity comes from simplicity and focus. Your headline should clearly state the benefit or outcome of your offer, not just describe the product. Supporting copy should answer the immediate questions that a visitor might have. These often include: What is this? Why should I care? How do I get started? What will happen next? Avoid trying to say everything at once. Focus on the top concerns of your target visitor and build your narrative around that.
Another component of clarity is visual hierarchy. Even if your copy is strong, if it is buried in a cluttered layout or surrounded by distractions, the message will not be absorbed. Use visual cues such as spacing, bolding, contrasting colors, and directional elements to guide the user’s eye. Your most important message should be the most visually prominent element on the page.
Case studies and customer testimonials can also support clarity and relevance. By showing how real people benefit from your product or service, you make your offer more relatable and easier to understand. If you are targeting a specific type of customer, choose testimonials that reflect that audience’s concerns and goals.
In summary, if you are experiencing low conversion rates, do not overlook the possibility that your offer or message simply does not connect. Improving copy clarity, aligning your value proposition with your traffic intent, and eliminating ambiguity can lead to dramatic gains in performance. Often, it is not about changing everything. It is about saying the right thing, to the right people, in the clearest possible way.
Heatmap and Behavior Clues That Confirm Conversion Friction
When your analytics show a low conversion rate, but the source of the problem is unclear, behavior analysis tools can reveal what numbers alone cannot. Heatmaps, scroll tracking, session replays, and click analysis provide visual evidence of how users are engaging with your landing page. These tools help uncover conversion friction that may not be obvious through traditional data, giving you the ability to spot usability issues, cognitive overload, or even emotional hesitation.
Heatmaps show where users are clicking, hovering, or ignoring. If your primary call to action is placed in a cold zone with little interaction, that suggests a visibility or placement issue. Conversely, if users are frequently clicking on non-interactive elements such as decorative images, menu items, or unrelated text, this can indicate confusion or unmet expectations. A high number of clicks in the wrong places points to poor information hierarchy or misleading design cues.
Scroll maps are another valuable tool. They show how far down the page users are scrolling. If only 25 percent of users make it past the hero section, but your value proposition or form is located below the fold, you are losing potential conversions to poor content placement. You might also notice that visitors are dropping off just before a key section, such as pricing or testimonials. This signals a bottleneck, where something is either visually discouraging or cognitively overwhelming.
Click maps and rage click data offer more granular insights. Rage clicks happen when users repeatedly click on an element that does not respond. This behavior suggests frustration and can pinpoint broken links, unresponsive buttons, or even deceptive design patterns. For example, if users think a product image or icon should lead to more information but nothing happens when they click, it creates a sense of distrust or disappointment. Tools like Microsoft Clarity, Hotjar, and FullStory all offer this feature, often with video session replays to see the behavior in context.
Session recordings allow you to watch real user sessions as they navigate your landing page. You can observe hesitation, repetitive actions, fast scrolls, and early exits. This is particularly useful for understanding what happens before a user bounces. Did they hover over a confusing paragraph for several seconds? Did they add a product to the cart but abandon it after the shipping information was revealed? These are moments of friction that might not appear in GA4 reports, but are visible through behavioral analysis.
Another telling behavior pattern is backtracking. If a user scrolls down the page, clicks on a link or button, then quickly returns, it might mean they did not find what they expected. Repetitive scrolling up and down can also suggest that users are searching for information that is missing, unclear, or poorly placed. This creates unnecessary cognitive load, which often results in page abandonment.
Additionally, heatmap and behavior tools can help segment by device or traffic source. If mobile users are struggling with tap targets or pinch-zooming on product images, you will see erratic gestures or fast bounces. If paid ad traffic from social platforms is clicking on CTA buttons but not completing forms, the issue may be friction within the form itself rather than the page as a whole.
In summary, behavior analysis is essential when diagnosing low conversion rates. Data can tell you what is happening, but heatmaps and session replays show you why. If you suspect that users are struggling with your landing page, these tools can quickly identify whether friction exists, where it occurs, and how it affects conversion decisions. Use this insight not as a replacement for analytics, but as a complementary method to see your landing page through the eyes of your visitors.
Conversion Dip After a Site Redesign or Tech Update
It is not uncommon for businesses to experience a sudden drop in landing page conversions after launching a new website design or implementing a technical update. In some cases, this dip is temporary and expected. In others, it signals a deeper issue that needs immediate attention. While the intention behind a redesign is usually positive, such as improving usability or aligning with brand evolution, the unintended consequences can hurt performance if not managed carefully.
A common scenario is when a business rolls out a redesigned landing page with updated visuals, fonts, layout, and messaging. While the new version may look more modern or better reflect the brand’s identity, conversion rates suddenly fall. This is not always due to poor design, but rather to changes that unintentionally disrupt familiar navigation patterns, remove effective elements, or obscure the page’s core message. If the original version was converting well, altering key structures without validating their performance can do more harm than good.
Another frequent issue comes from changes in page structure. For example, if the previous version had a prominent headline and call to action above the fold, but the redesign introduces a large hero image that pushes those elements down the page, it can delay user action and reduce engagement. The user might not even realize what the page is offering without scrolling. Similarly, removing trust signals like reviews, testimonials, or security badges in favor of minimalist design can lower user confidence and reduce conversion likelihood.
Technical updates can have just as much impact. Moving your site to a new platform, updating your CMS, switching analytics tools, or changing hosting providers can all introduce performance issues. Pages might load more slowly, track incorrectly, or experience compatibility issues on certain devices or browsers. In particular, third-party integrations like payment processors, form submissions, and pop-ups may break if not tested rigorously during deployment.
Redirects and broken links are another risk. If URLs are changed during the redesign without proper redirection, traffic from paid ads, social media, or SEO rankings might land on 404 pages. Even a small misconfiguration in URL structure can render high-performing pages inaccessible, leading to missed conversions and increased bounce rates. Regular crawl tests using tools like Screaming Frog or Sitebulb can catch these issues early.
Another hidden impact is the way users perceive change. Frequent visitors or repeat customers often build expectations around how a site functions. If a familiar process suddenly changes without explanation, it can disrupt the user journey. This is especially important for returning visitors who have previously converted. If the navigation, product display, or checkout flow changes too drastically, users may hesitate or abandon the process altogether.
To manage these risks, treat every redesign or update as a testing opportunity. Before making permanent changes, run A/B tests comparing the new version against the old. Track not only conversion rates, but also engagement signals such as time on page, click depth, scroll behavior, and form completions. Document each change and measure its impact individually rather than launching multiple updates at once. This will allow you to isolate which changes are helping or hurting performance.
In conclusion, a drop in landing page conversions following a redesign or technical update is not unusual, but it should never be ignored. If the dip lasts more than a few days or coincides with user complaints or engagement losses, it is critical to investigate. A new look or improved infrastructure only creates value if it supports clarity, speed, and usability. Without careful testing and iteration, even the most aesthetically pleasing redesign can undercut your most important business goals.
High Ad Spend with Poor Return: A Red Flag Combo
One of the most alarming signs of a landing page problem is when you are investing heavily in paid media but not seeing a return that justifies the cost. If you are running ad campaigns across Google Ads, Meta, TikTok, or other platforms and your cost per click is rising while your conversion rate is flat or declining, the issue may not be with the ads themselves. In many cases, this imbalance points directly to the landing page and how effectively it is turning visitors into customers or leads.
When you spend thousands on ad traffic, every percentage point in conversion rate matters. Consider an example: if your brand spends $10,000 on ads and drives 20,000 visitors at $0.50 per click, but your landing page only converts at 1 percent, that results in 200 conversions. If your average order value is $40, your revenue is $8,000, which means you are losing money despite a high level of interest. Now, imagine if the conversion rate drops to 0.6 percent. You now have only 120 conversions and $4,800 in revenue, further increasing your acquisition cost and decreasing your profitability.
These problems are often masked by vanity metrics such as impressions, clicks, or even engagement on the ad itself. You may feel encouraged by a strong click-through rate or a well-performing video, only to be puzzled when conversions do not follow. This disconnect often signals that the landing page is not aligned with the expectations set by the ad. If users are excited to learn more but become confused, overwhelmed, or disappointed upon landing, they will exit without converting.
Another risk is found in automated bidding strategies that optimize for clicks or impressions rather than conversions. Platforms may increase ad delivery to audiences that are likely to click but not necessarily likely to convert. In these scenarios, a weak landing page will exacerbate the problem, compounding wasted ad spend with poor post-click performance. Regularly reviewing campaign-level ROAS and comparing it to landing page conversion data is essential to identify these inefficiencies.
Segmentation is your best tool for diagnosis. Break down conversion performance by campaign, ad group, keyword, or creative. If certain segments are performing well while others consistently underdeliver, it can help you isolate the cause. For instance, you may find that branded keywords convert at 3 percent while broad match terms drive traffic that bounces immediately. This suggests that the landing page may only resonate with users who already know your brand and may not be optimized for colder audiences.
UTM tracking is crucial here. Proper tagging of campaigns, creatives, and platforms allows you to identify which sources bring the most qualified traffic. If one ad set sends 1,000 visitors and only one person converts, but another ad set sends 800 visitors with 20 conversions, the problem is likely tied to alignment between the ad content and landing page messaging or structure.
Finally, do not overlook mobile versus desktop breakdowns. Ad platforms often push more volume to mobile, especially on social platforms. If your page is not responsive or optimized for mobile behavior, a large portion of your ad spend may be landing on a page that users find difficult to interact with, which can drive costs up and conversions down.
In summary, high ad spend paired with poor conversion results is one of the clearest indicators that your landing page needs attention. Instead of increasing budget in hopes of better outcomes, focus on optimizing the user experience, clarity of message, and alignment with ad expectations. Once your landing page converts consistently, scaling traffic becomes far more sustainable and profitable.
How to Diagnose and Take Action (Before It Gets Worse)
When your landing page conversion rate begins to fall, taking swift and structured action is essential. Waiting too long can result in wasted ad spend, missed revenue, and a damaged brand perception. Instead of reacting with guesswork, approach the problem methodically. A strong diagnostic process helps you pinpoint the source of the issue and choose the right corrective path. The goal is to treat the cause, not the symptoms.
Start by reviewing your traffic quality and segmentation. Break down conversion performance by source, campaign, and device. A consistent drop across all traffic channels suggests a site-wide issue, while a decline limited to one source may point to targeting, creative, or messaging problems specific to that campaign. If mobile traffic is converting poorly while desktop holds steady, examine mobile-specific UX elements such as page load speed, tap targets, and form usability.
Next, assess your engagement metrics. Metrics like bounce rate, average session duration, and scroll depth can highlight where users disengage. If your bounce rate is climbing while conversion falls, it often signals a mismatch between what visitors expect and what they experience. If users scroll but do not take action, there may be friction in your offer, messaging, or layout that requires refinement.
Once you identify suspicious patterns, use behavior analysis tools to dig deeper. Heatmaps, click maps, and session recordings can uncover micro-behaviors that traditional analytics miss. Look for indicators such as rage clicks, rapid exits, or scroll hesitation. These behaviors reveal frustration or confusion and can highlight areas of your landing page that need to be redesigned or clarified.
In parallel, conduct a technical audit of your landing page. Use performance tools such as PageSpeed Insights or WebPageTest to check load times, especially on mobile. Test all interactive elements, including buttons, forms, and links. Verify that tracking pixels and analytics tools are firing correctly. If your analytics setup is broken, you may not be capturing the full extent of the problem.
Evaluate your message clarity and offer relevance. Does your headline clearly state the benefit of your product or service? Is your call to action visible, specific, and actionable? Does the content of the landing page align with the user’s expectations from the referring source? If the value proposition is buried, vague, or too complex, visitors are less likely to convert.
Once you gather these insights, build a prioritized action list. Address high-impact, low-effort issues first. For example, fixing a broken form or moving a CTA above the fold can have an immediate effect. Larger changes, like revisiting your offer structure or redesigning the page layout, should be approached in a measured way. Use A/B testing to validate hypotheses and confirm that changes are driving results rather than introducing new problems.
Also, consider implementing real-time alerts and dashboards. Tools like GA4, Looker Studio, or Mixpanel allow you to set alerts when conversion rates fall below a certain threshold. This helps you catch future dips early and respond before the issue escalates.
Finally, involve the right people. Conversion rate issues often sit at the intersection of marketing, product, and development. Bring in CRO experts, UX designers, and developers when needed. Collaboration leads to faster diagnosis and more effective solutions.
In summary, diagnosing a low-converting landing page requires more than instinct. A structured, data-driven approach lets you isolate the problem, act quickly, and prevent further performance loss. The longer you wait, the more difficult and costly the recovery becomes. Timely action, informed by the right tools and analysis, is the best safeguard for your business growth.
Conclusion: Know the Difference Between a Dip and a Danger Zone
Low landing page conversion rates can signal many things. Sometimes they are short-term fluctuations that resolve naturally. Other times, they are early warning signs of deeper issues that require immediate intervention. The key to protecting your marketing investment and maintaining business growth lies in learning how to distinguish between a passing dip and a true danger zone.
Not every low-converting day is a crisis. Consumer behavior can be affected by external factors like holidays, competitor promotions, economic uncertainty, or even changes in the weather. A slight dip over one or two days, especially when accompanied by lower traffic or less qualified visitors, may not warrant concern. However, if that dip stretches into a consistent pattern across a week or more, you need to take notice.
What separates a temporary slump from a real problem is persistence, scope, and visibility across multiple data points. A decline in conversions that continues for several weeks, impacts all traffic channels, and is accompanied by other metrics like increased bounce rate or shorter session durations is a clear red flag. This combination indicates more than just seasonal behavior. It suggests a breakdown somewhere in your funnel that is likely costing you money and undermining your marketing efforts.
Throughout this article, we explored how to evaluate conversion rates in context. We reviewed industry benchmarks, traffic intent, user experience, behavioral clues, technical functionality, and the alignment between offer and message. Each of these components contributes to your landing page’s performance. When any of them falter, your conversion rate will reflect it.
Many businesses fall into the trap of reacting emotionally or randomly when conversion rates drop. They overhaul the entire page without data, change traffic sources without testing, or increase ad spend hoping to brute-force their way to success. These approaches often worsen the problem. What you need instead is a disciplined process of diagnosis, prioritization, and testing.
Begin with the basics. Confirm your traffic quality and segmentation. Review user behavior using heatmaps and session recordings. Audit for technical issues like load speed and broken elements. Then, evaluate whether your messaging clearly communicates value and whether your offer remains relevant to the current audience. Only after you complete these steps should you begin to implement targeted improvements.
You should also understand that optimization is not a one-time task. Landing page performance needs continuous monitoring. Consumer preferences evolve, competitors update their strategies, and platform algorithms change constantly. What worked well last quarter may become outdated this quarter. That is why ongoing analysis and testing are essential.
By knowing how to interpret patterns in your conversion data, you put yourself in a stronger position to respond effectively. Whether you are an ecommerce brand, a SaaS provider, or a service-based business, the principles remain the same. Your landing page is a living asset, and it needs regular attention to perform at its best.
Ultimately, the most successful brands are those that treat conversion dips not as setbacks but as opportunities to learn, adapt, and improve. When you recognize the early signals and act decisively, you protect not just your marketing efficiency, but the long-term growth potential of your entire business.
Research Citations
- Bai, X., Gao, L., & Liu, Y. (2021). Effects of website design on consumer trust and purchase intention. Journal of Retailing and Consumer Services, 58, 102-116.
- Baymard Institute. (2024). Ecommerce checkout usability: Research findings and benchmark database.
- CXL. (2023). Conversion rate optimization case studies. CXL Institute.
- Google. (2023). Think with Google: The need for mobile speed.
- Hotjar. (2024). Heatmaps, recordings, and behavior analytics for improving UX.
- Microsoft Clarity. (2024). Behavior analytics and session recording tools. Nielsen Norman Group. (2022). UX research findings and best practices for landing pages.
- Statista. (2023). Average conversion rates of ecommerce websites worldwide.
- Unbounce. (2023). Conversion Benchmark Report: Landing page performance across industries.
- WordStream. (2023). Google Ads industry benchmarks for average conversion rates.
FAQs
This depends on your industry, offer type, and traffic source. For ecommerce, a conversion rate below 1.5 percent is generally considered low. For lead generation pages, anything under 3 to 5 percent could be cause for concern. Always compare your rate to industry benchmarks and your own historical performance to judge effectively.
If the decline lasts more than 7 to 10 days and affects multiple traffic sources or audience segments, it is time to investigate. One or two days of underperformance can happen due to temporary factors, but a sustained trend suggests a structural issue that needs attention.
Yes. If your ads are attracting the wrong audience or promising something that is not reflected on the landing page, users may click but fail to convert. That is why alignment between ad messaging and landing page content is critical. Analyze your campaigns using UTM data to determine if certain ad groups or keywords are consistently underperforming.
Use tools like Google PageSpeed Insights, Lighthouse, or GTmetrix to check load speed and performance. Also test your landing page on multiple devices and browsers. Check for broken links, form errors, or non-functioning buttons. Even small issues can cause users to abandon the page.
Behavior data from heatmaps, session recordings, and scroll maps provides insight into how users interact with the page. If users are hovering without clicking, rage-clicking on inactive elements, or exiting at specific points, this indicates friction or confusion. These tools give you the context behind the numbers.
Not always. First, verify the source of the issue. Sudden changes can make things worse if the problem lies elsewhere. Use a structured diagnostic process that includes traffic review, behavior analysis, and technical checks. Only implement changes once you have a clear understanding of what is underperforming.
Use A/B testing tools like Google Optimize, VWO, or Convert to test different versions of your landing page. Focus on one variable at a time, such as headline, CTA placement, or offer format. This controlled approach helps you learn what works without guessing.
Is a redesign always the best solution for low conversion?
No. Redesigns are time-consuming and can introduce new risks. Often, smaller adjustments to copy, form structure, or visual hierarchy have a greater impact. Redesigns should be backed by data and tested gradually to avoid harming existing performance.
Absolutely. If your offer no longer appeals to your target audience or has not evolved with changing needs, your landing page may not convert regardless of how it looks or functions. Regularly test different incentives such as limited-time discounts, free trials, or product bundles to maintain relevance.
The most frequent issues include unclear headlines, weak value propositions, slow load times, distracting design elements, broken forms, and calls to action that are not visible or compelling. Each of these can hurt performance, especially when combined.