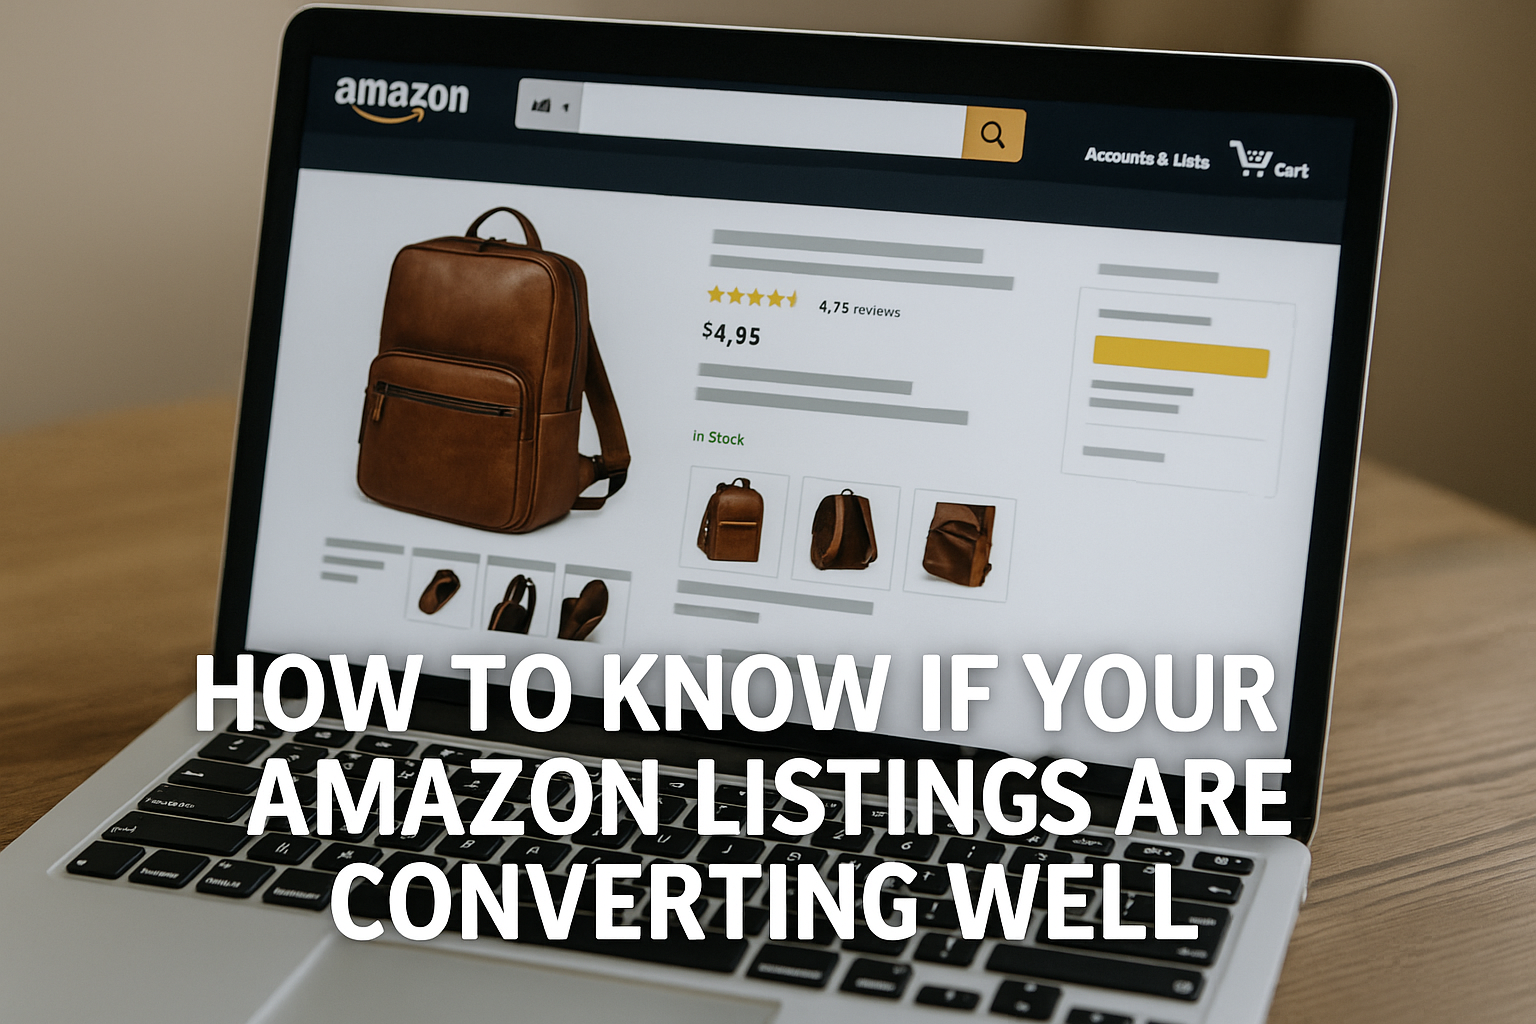
Why Amazon Conversion Matters More Than You Think
Success on Amazon is not just about getting traffic to your product listings. It is about what happens after a shopper lands on your page. Your ability to convert that attention into a sale is what ultimately determines profitability, ad efficiency, and long-term growth. Conversion rate is not a vanity metric. It is a performance signal that influences your visibility, your ad performance, and even your eligibility for placement in key search positions.
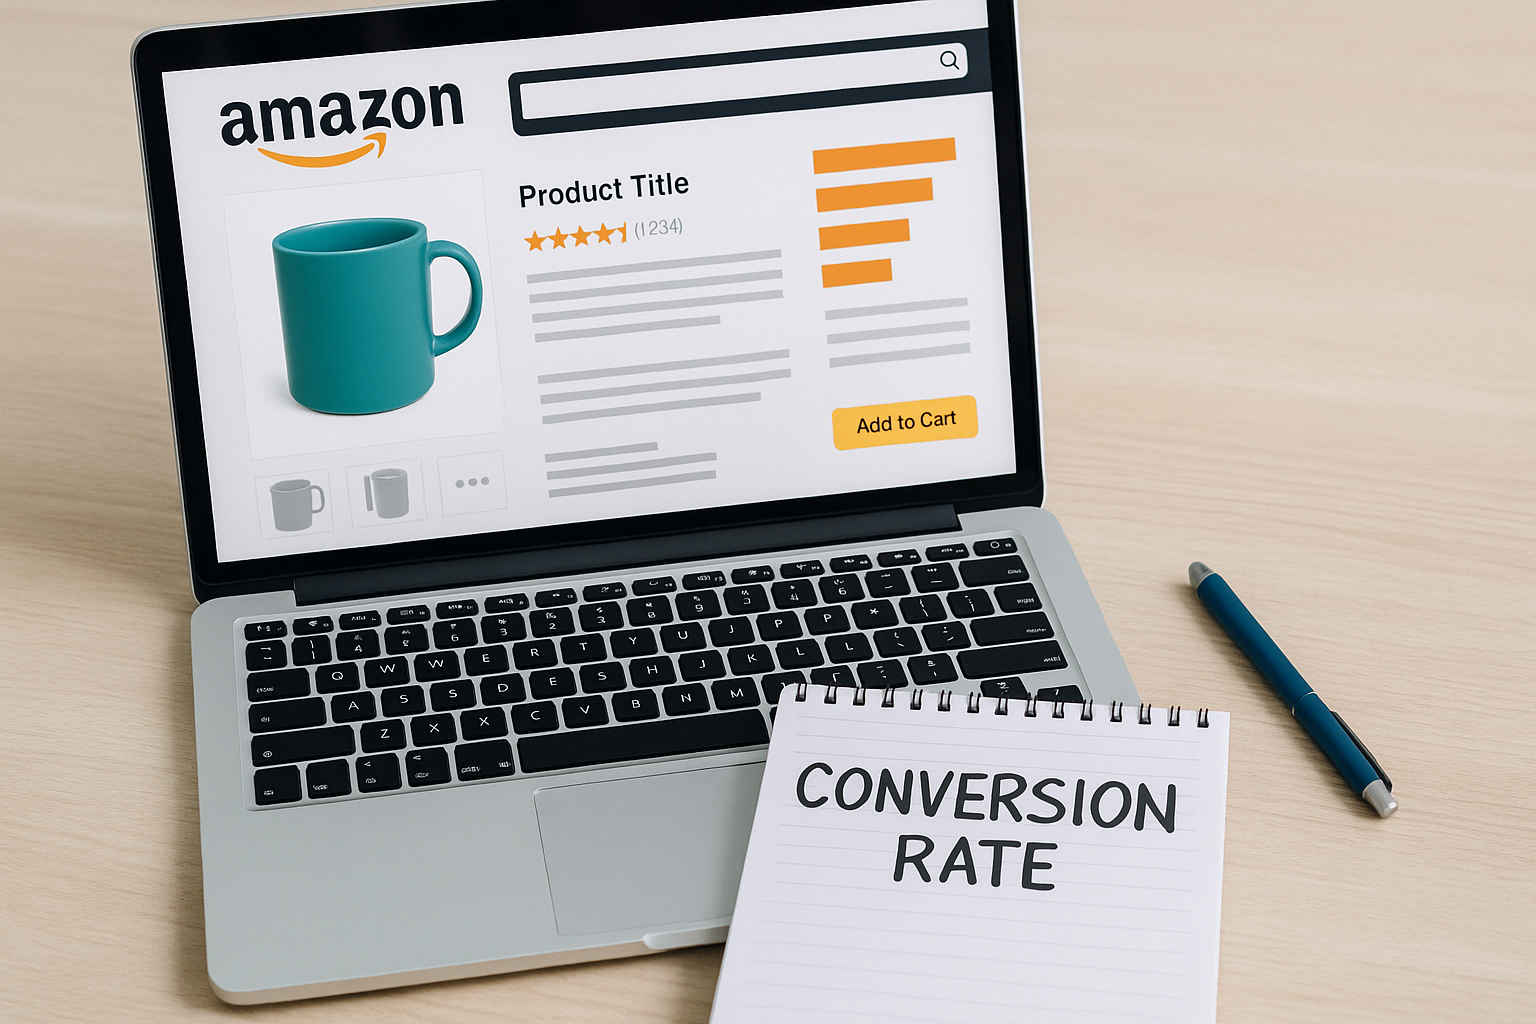
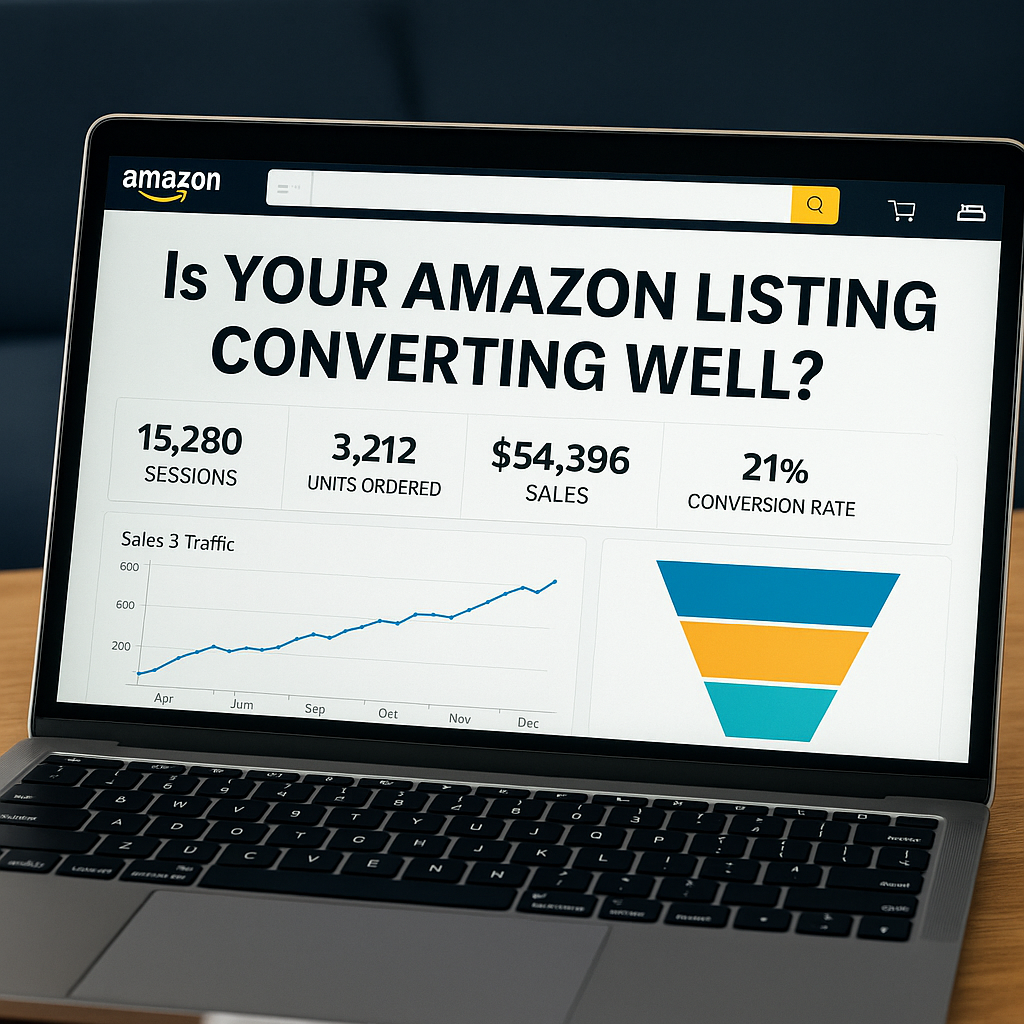
In the Amazon ecosystem, conversion rate is typically tracked using a metric called Unit Session Percentage. This figure represents the percentage of sessions on a listing that result in a purchase. Unlike traditional e-commerce platforms that calculate conversion based on pageviews or overall sessions across a site, Amazon tracks it at the individual product level. If 100 customers view your product detail page and 15 of them buy, your Unit Session Percentage is 15 percent. This is your conversion rate in Amazon’s terms, and it matters more than many sellers realize.
Amazon’s algorithm favors listings that perform well. When your conversion rate is high, Amazon is more likely to feature your product higher in search results, reward you with more prominent ad placements, and help you win the Buy Box more often. Conversely, listings that receive traffic but fail to convert signal low relevance or poor customer experience. Amazon does not want to send shoppers to listings that fail to result in sales. If your conversion rate lags, your visibility may drop, and your ad campaigns can become less efficient, costing more to generate the same revenue.
The stakes are even higher for sellers using Sponsored Products or other forms of paid traffic. Advertising without knowing how well your listing converts is like pouring money into a leaky bucket. You might generate clicks and even impressions, but if the listing does not persuade the customer to buy, your ad budget will produce diminishing returns. Improving conversion increases your return on ad spend, which in turn improves campaign performance and drives organic sales as a byproduct.
Understanding your conversion rate also helps you make smarter catalog decisions. You can identify which products deserve more ad budget, which listings need to be improved, and which SKUs may not be worth scaling further. If you are launching new products, conversion insights from your best-performing listings can guide how you write copy, price your items, or structure your images. Without this information, you are guessing. And on a platform as competitive as Amazon, guessing leads to waste.
This blog post will guide you through the specific metrics that define Amazon conversion success, how to access and interpret those metrics, and what steps to take if your listings are underperforming. You will also learn how to benchmark your performance, test improvements, and establish an optimization workflow that supports long-term growth.
If you want to build a more profitable and sustainable presence on Amazon, understanding and improving your listing conversion rate is not optional. It is a requirement for success in an increasingly data-driven marketplace.
Understanding Amazon's Key Metrics for Conversion
Before you can improve your listings, you need to understand the core metrics that indicate how well they are performing. Amazon provides several important performance indicators within Seller Central that help sellers assess conversion efficiency. However, many sellers either misinterpret these numbers or focus on the wrong ones. To make sound decisions, you need to know what each metric represents, how it is calculated, and when it truly matters.
The most critical conversion metric on Amazon is Unit Session Percentage. This metric shows the percentage of units purchased compared to the number of unique sessions on a product detail page. For example, if your listing receives 1,000 sessions and sells 120 units, your Unit Session Percentage is 12 percent. Unlike website analytics, where a session might include browsing multiple pages, Amazon defines a session as a single visit to one or more of your product pages by a unique user within a 24-hour period. This helps standardize the measurement across categories.
Another important metric is Buy Box Win Rate, especially if you are a reseller or if multiple sellers are listing the same product. The Buy Box is the default “Add to Cart” option on a product detail page. If you do not own the Buy Box, most of your traffic may not convert at all. Even if you are driving external traffic or running Amazon Ads, a low Buy Box Win Rate will destroy your conversion potential because the sale might go to another seller. To evaluate whether your listing’s performance reflects your actual sales potential, you must first ensure you are consistently winning the Buy Box.
You should also pay attention to Sessions and Page Views. Sessions, as mentioned earlier, are unique visits, while Page Views count every time your listing is loaded, regardless of whether it is the same customer viewing it multiple times. A high number of Page Views relative to Sessions might indicate customers are returning to the page but are hesitant to purchase. This can be a red flag for pricing concerns, unclear messaging, or competing products offering better value. By comparing these metrics with Unit Session Percentage, you can uncover behavioral patterns that point to conversion bottlenecks.
Beyond these standard metrics, experienced sellers often consider Total Order Items, Total Sales, and Advertising Conversion Rate as supporting data. However, these should be interpreted within the context of listing performance. For example, a spike in sales does not necessarily mean your listing is converting well if it required a disproportionate amount of ad spend. Likewise, if your Advertising Conversion Rate is significantly lower than your organic conversion rate, it may suggest that your ad traffic is not well targeted or that the listing lacks relevance for the keywords you are bidding on.
Understanding these metrics in isolation is not enough. The real insight comes from comparing them over time and against category benchmarks. What is considered a good Unit Session Percentage in one niche might be underperforming in another. This variability makes it essential to take a holistic view and monitor trends, rather than reacting to daily fluctuations. Later sections will walk you through how to access these metrics, interpret them within your product category, and take strategic action based on what the data tells you.
Accessing and Interpreting Your Business Reports in Seller Central
To determine whether your Amazon listings are converting well, you must first know how to access and interpret the relevant performance data. This starts with navigating the Business Reports section inside your Seller Central account. While Amazon’s analytics tools are not always user-friendly, they contain valuable insights once you understand where to look and how to analyze the right columns.
Start by logging into your Seller Central account. From the main dashboard, go to the “Reports” tab on the top menu and click on “Business Reports.” Once there, you will see a sidebar with different report categories. The most useful report for evaluating listing performance is called “Detail Page Sales and Traffic by Child Item.” This report provides session data, sales figures, and conversion metrics broken down by each SKU or ASIN. It gives you a line-by-line view of how each product is performing in relation to shopper traffic.
Within this report, you will find several important columns. The most relevant one for conversion is Unit Session Percentage. As discussed in the previous section, this figure represents the number of units sold divided by the number of unique sessions. A session is counted when a user visits your product detail page at least once in a 24-hour window. If a customer views multiple products in your catalog, each listing will register a separate session. This is Amazon’s way of isolating performance per product, rather than combining sessions across your entire store.
When interpreting this data, make sure to consider the date range. The default setting often shows only the last seven days, which can produce misleading fluctuations if your traffic or sales are inconsistent. It is better to analyze data over a longer period, such as the past 30 days or the current quarter, to smooth out short-term spikes or drops. You can adjust the date range using the dropdown menu at the top of the Business Reports page.
Next, look at the Sessions and Page Views columns. Sessions tell you how many unique visitors landed on the product page. Page Views count every time the listing was loaded, even if it was the same visitor viewing it multiple times. If you see a high number of Page Views but a low number of Sessions, it could mean that repeat visitors are returning to evaluate the product again, possibly due to uncertainty. This signals a potential friction point in your listing, such as unclear images, weak reviews, or lack of persuasive detail.
Another column to observe is Buy Box Percentage, especially if you are not the only seller listing that product. If your Buy Box win rate is low, your Unit Session Percentage will be misleading, since shoppers may be clicking “Add to Cart” but the sale is going to another seller. To get an accurate read on your conversion performance, make sure your listings consistently win the Buy Box, or isolate the data to only products where you are the sole seller.
You can also export the Business Reports into Excel or Google Sheets to conduct deeper analysis. This allows you to create pivot tables, apply filters, and track trends over time. Monitoring these numbers weekly or biweekly will help you identify which listings are improving, which are declining, and which need urgent attention.
In summary, the Business Reports section in Seller Central is your primary source of truth for measuring listing conversion. Learning how to navigate and interpret these metrics is not optional if you are serious about optimizing your Amazon performance. Once you are confident with these reports, you can begin identifying patterns and making data-backed decisions that lead to measurable gains in revenue and profitability.
What Is a “Good” Conversion Rate on Amazon?
One of the most common questions Amazon sellers ask is: what qualifies as a good conversion rate? The answer depends on several factors, including your product category, price point, traffic source, and competition level. While there are general benchmarks that can provide helpful context, it is essential to interpret your numbers in relation to your specific niche and product type rather than applying one-size-fits-all expectations.
Amazon does not publish official average conversion rates across categories, but industry research and seller experience suggest that the platform’s average Unit Session Percentage tends to range between 10 percent and 15 percent. This is significantly higher than the average e-commerce site, where conversion rates often hover around 2 percent to 3 percent. The higher conversion on Amazon is due to its built-in trust, streamlined checkout process, and customer intent. Shoppers on Amazon are often in buying mode, not just browsing.
That said, averages can be misleading if you do not segment them by product type. For instance, low-ticket items such as phone chargers, kitchen gadgets, or beauty tools often have conversion rates in the 20 percent to 30 percent range. These items require minimal decision-making and usually fall within an impulse-buy price range. On the other hand, high-ticket products like electronics, appliances, or furniture may have conversion rates as low as 5 percent to 10 percent, which can still be considered strong performance given the longer customer decision journey.
It is also important to differentiate between organic conversion and paid traffic conversion. Organic traffic, driven by search results and browsing behavior, often produces higher conversion rates because it captures intent. If a shopper searches for “ceramic coffee dripper” and clicks your listing, they are likely closer to purchase. In contrast, paid traffic from Sponsored Products or external ads may include colder traffic segments that require more persuasion. Comparing your Unit Session Percentage across both traffic types can give you valuable insight into how your listings perform with different audiences.
Another factor to consider is seasonality. A product may convert poorly during certain months and peak during others. For example, outdoor gear might dip in conversion during winter, even if traffic remains steady. Evaluating performance in isolation without understanding seasonal trends can lead to poor decisions, such as pausing ad spend or overhauling a listing that is simply off-season.
A good practice is to benchmark against your own listings, rather than just industry averages. If you have a group of 10 products and three of them consistently convert at 18 percent or higher, while others are below 10 percent, that signals an opportunity. Start by examining what sets the higher-performing listings apart. Do they have stronger imagery, more reviews, better pricing, or clearer copy? These internal benchmarks are often more valuable than chasing arbitrary external targets.
Also, make use of category-specific reports and third-party analytics tools. Some platforms aggregate anonymized seller data to provide more accurate conversion benchmarks by product type. This can help you set more realistic goals and assess whether your listings are competitive within your niche.
Ultimately, there is no universal number that defines success. A good conversion rate is one that consistently improves over time, holds steady under higher traffic volume, and supports a healthy profit margin. By focusing on continuous improvement and category-specific context, you can evaluate performance more effectively and make decisions that grow your Amazon business with less guesswork.
Diagnosing Conversion Problems in Underperforming Listings
Once you understand what metrics to track and what benchmarks to expect, the next step is diagnosis. If a listing is getting traffic but not generating conversions, something is preventing customers from completing the purchase. Conversion problems are rarely caused by a single issue. In most cases, multiple friction points are working together to create resistance. Knowing where to look and how to analyze each element of the listing will help you fix what is holding your performance back.
Start with product images, since they are the first element shoppers notice on both search results and product pages. The main image must meet Amazon’s technical requirements and clearly show the product without clutter. However, it should also be visually compelling and easy to understand at a glance. If your competitors have cleaner, higher-resolution, or more informative visuals, you are likely losing clicks and conversions. Secondary images should showcase key features, use cases, sizing, packaging, and in-context usage. A listing with only one or two images, or with generic white-background photos, often signals low effort or limited credibility.
Next, review your product title and bullet points. A common mistake is to either stuff keywords without clarity or write vague copy that does not communicate benefits. A strong title should include the brand, product type, key attributes, and size or color if applicable. It should be scannable and readable. Bullet points should answer the customer’s most immediate questions. What does it do? Who is it for? What makes it better than alternatives? If your copy is too generic, filled with fluff, or difficult to scan quickly, customers may leave the page without making a decision.
Price positioning is another major factor. Even if your product is well-presented, a price that feels too high or suspiciously low can break trust. Shoppers often compare listings side by side. If your offer lacks a perceived advantage, you will lose out. Use a tool or a manual check to compare your pricing, especially when factoring in shipping, discounts, and bundle value. Sometimes, even a one-dollar difference in price or an added bonus item can dramatically shift conversion behavior.
Do not overlook the reviews and ratings. A product with a rating below 4.0 often struggles to convert, regardless of how good the rest of the listing looks. But it is not just the star count that matters. Customers read the most recent reviews to assess current product quality and shipping reliability. A wave of negative or lukewarm reviews may require action beyond listing optimization, such as improving your supply chain, updating the product version, or proactively requesting feedback from satisfied customers.
Also examine the A+ Content, if your brand is enrolled in Amazon Brand Registry. A+ Content gives you more control over layout and storytelling. You can include comparison charts, branded visuals, FAQs, and narrative-driven selling points. Poorly structured or outdated A+ Content can waste this opportunity. If you are not using A+ at all, you are giving up a proven tool that can improve both trust and conversion.
Lastly, assess any technical or logistical barriers. Check for issues like suppressed listings, incorrect product details, or delivery estimates that may scare customers off. A delayed shipping promise or a lack of Prime eligibility can affect conversion, especially for impatient or time-sensitive buyers.
In summary, diagnosing conversion problems requires a methodical review of each component of the product page. From visual presentation to pricing strategy and buyer trust signals, every detail plays a role. The key is to isolate where the drop-off is happening and remove unnecessary friction, allowing the listing to do its job more effectively and consistently.
How to Optimize Your Listing for Better Conversion Rates
Once you have identified underperforming listings, the next step is to implement targeted improvements. Conversion rate optimization on Amazon is a deliberate, ongoing process. While many sellers focus on traffic generation, a high-converting listing does more with less. It turns visitors into buyers without requiring excessive advertising spend. The goal is to build product pages that communicate value quickly, reduce shopper hesitation, and make the purchase decision feel like the obvious next step.
Start with your main image. This is the single most important visual asset on your listing. It must meet Amazon’s technical requirements, but that is only the baseline. The image should be clear, well-lit, and show the product in a way that makes its purpose instantly understandable. Avoid excessive white space or strange angles. If your product is small or intricate, consider zoomed-in details for secondary images. Use lifestyle photos to show the item in real-world settings, ideally reflecting your target customer’s environment. Show hands using the product, demonstrate scale, and highlight any unique features. Every image should tell part of the story.
Next, refine your product title. The title must include essential keywords, but readability is equally important. Avoid keyword stuffing. Include only what helps customers make an informed decision. A strong structure might be: brand name, product name, key feature or benefit, size, quantity, or color. Focus on what matters to the shopper. If your competitors are ranking well with clearer, more focused titles, it is worth testing your structure.
Move on to your bullet points. This is where many listings lose the customer. Instead of listing generic features, use each bullet to highlight a specific benefit. Start with a strong phrase in all caps, followed by a clear, persuasive explanation. For example, instead of writing “High Quality Material,” try “BUILT TO LAST – Crafted from durable, BPA-free plastic that resists cracks and fading over time.” Use simple language that answers customer questions and addresses objections.
If your brand is enrolled in Brand Registry, make full use of A+ Content. This section allows for more engaging visuals and formatted text. Include product comparisons, branded imagery, and feature callouts that help shoppers visualize ownership. Use FAQs to address common concerns directly. Keep your layout mobile-friendly, since many shoppers browse and buy from their phones.
Pay close attention to price positioning and offers. Make sure your price is competitive within your niche. This does not always mean being the cheapest. Sometimes, you can justify a higher price with better presentation, stronger reviews, or added value like bundles or warranties. Test limited-time coupons, Subscribe & Save options, or volume discounts if available in your category. These can nudge hesitant buyers to take action.
Also focus on social proof. Work to increase your review count and overall rating through legitimate post-purchase strategies. Follow up with customers using Amazon’s Request a Review feature. Consider enrolling in the Vine Program for new products if eligible. Reviews influence conversion heavily, especially above or below the 4.0-star threshold.
Finally, monitor your results. Track your Unit Session Percentage weekly and compare before and after each optimization. If you run Amazon Ads, measure your organic and paid conversion rates separately to assess the full impact of changes.
Optimizing your listing is not about guesswork or copying competitors blindly. It is about making intentional improvements that speak directly to your ideal customer. When you align every part of the page with what shoppers care about most, conversion lifts naturally, and profitability improves without increasing spend.
Using Amazon Advertising Data to Evaluate Conversion Performance
Amazon Ads play a vital role in the visibility and profitability of your listings, but they also provide some of the most actionable insights into how well your product pages convert. Whether you are running Sponsored Products, Sponsored Brands, or Sponsored Display campaigns, each ad type comes with detailed metrics that go beyond traffic. When analyzed properly, this data can help you diagnose conversion issues, refine your targeting, and optimize listings with greater precision.
Start by focusing on Advertising Cost of Sales (ACoS) and Return on Ad Spend (RoAS). While these metrics are typically used to evaluate ad profitability, they can also serve as indirect indicators of conversion health. A low RoAS or high ACoS may point to two possibilities: either the keywords are poorly targeted, or the listing itself is not convincing shoppers to buy. If you are driving high traffic volumes but not generating proportional sales, the listing may not be aligned with the intent behind those clicks.
Next, examine your Click-Through Rate (CTR). A low CTR usually signals that your ad creative, especially the main image and title, is not resonating with shoppers in the search results. But if CTR is high and conversion remains low, that tells a different story. It suggests the ad is doing its job of attracting attention, but the product page is failing to close the sale. This is a common pattern when there is a mismatch between what the shopper expects and what they see upon landing on the detail page. It may be due to unclear images, a lack of trust-building content, or a poor value proposition.
Conversion Rate (CVR) is available in the advertising dashboard and should be tracked alongside your organic Unit Session Percentage. These numbers rarely match exactly, because ad traffic behaves differently, but they should not diverge too much. A significantly lower CVR in your ad campaigns suggests either poor targeting or unoptimized listings. It can also indicate that shoppers being driven to your product are in an earlier stage of the buying cycle. In such cases, retargeting campaigns or more educational content in A+ sections can help build trust.
Segment your campaigns to compare conversion by keyword type, match type, and placement. For example, branded keywords often convert better than generic or competitor terms. Exact match campaigns typically drive more qualified traffic than broad match ones. Top of search placements may have higher CTRs but not always better conversion, especially if shoppers are clicking impulsively before evaluating options. These differences matter when deciding where to scale spend and which listings require more optimization work.
Also consider search term reports. These provide granular data on what shoppers actually searched before clicking your ad. By analyzing converting versus non-converting terms, you can identify which queries are misaligned with your product’s positioning. This helps you refine ad targeting, but also reveals where the listing copy might be misleading or incomplete. For instance, if many shoppers arrive on your page after searching for a feature your product lacks, they are unlikely to convert, and the issue is with expectations, not pricing or visuals.
To get the most value from Amazon Ads, combine your advertising data with insights from Business Reports. Track how conversion rates move when you change main images, adjust pricing, or modify bullet points. Use campaign-level data to test listing variations at scale, rather than making blind changes across your entire catalog.
In summary, Amazon Ads are more than a traffic lever. They offer diagnostic value that few other tools can match. By studying your campaign metrics in depth, you gain a second lens on conversion performance, one that can help validate listing improvements and uncover overlooked friction points. This dual-layer analysis, rooted in both organic and paid performance, is key to building high-converting listings that scale profitably.
Benchmarking Against Competitors: How to Identify Gaps in Your Listing Strategy
Understanding your own performance in isolation is helpful, but it does not tell the whole story. To truly know if your Amazon listings are converting well, you need to evaluate them in relation to your competitors. Benchmarking helps you identify what others in your category are doing better, where you may be falling short, and what strategies are gaining traction with buyers. This perspective allows you to adapt faster and position your products more effectively within the competitive landscape.
Start by identifying your closest competitors. These are not necessarily the bestsellers in your category, but rather the listings that appear most often alongside yours in search results, Sponsored Ads, and frequently bought together sections. Pay close attention to who ranks above and below you for your top-performing keywords. These are the listings that share your visibility and are likely drawing from the same customer pool.
Once identified, conduct a side-by-side comparison of your listings versus theirs. Focus first on visual presentation. How many images do they use? Are their main images more attention-grabbing? Do they use comparison charts or lifestyle photography that enhances trust and relatability? Visual appeal is one of the most powerful levers for increasing conversion, especially when buyers are scrolling quickly through search results. If your images are outdated, too technical, or unclear, you may be losing clicks before customers even reach your page.
Next, evaluate their titles and bullet points. Are they more benefit-focused? Do they highlight emotional drivers such as durability, ease of use, or suitability for gifting? Compare the tone and structure. Some sellers write for SEO, while others write to persuade. Ideally, you should aim for a balance of both. If a competitor is outranking you and has stronger conversion metrics, their copy structure may be more aligned with what buyers are looking for in that niche.
Check their pricing strategy as well. Are they using coupons, multi-pack offers, or bundling to increase perceived value? Even if your product is superior in quality, buyers often default to the option that feels like a better deal. This is not always about being the cheapest. It is about offering the clearest justification for the price through messaging and presentation. Consider whether your offer is easy to understand at a glance and whether any part of your offer is causing confusion or doubt.
Review count and star ratings are also important benchmarks. If a competitor has a higher review volume and similar or better star rating, shoppers may gravitate toward them simply due to perceived social proof. If you are in a position where you cannot match their review count, consider increasing your visual storytelling and using A+ Content to build trust in other ways. You should also invest in proactive review collection strategies to close that gap over time.
Another useful exercise is to simulate the buyer journey. Search your target keywords in incognito mode or on a fresh account. Look at which listings catch your attention and which ones you would click on first. Ask yourself why. Was it the image, the price, the reviews, or the language? Then go through the entire buying process for a few competitors, even up to checkout. This will give you a real-world view of the customer experience and help you pinpoint gaps in your own funnel.
Finally, track how your Unit Session Percentage compares over time after making adjustments inspired by competitor analysis. Use your Business Reports and advertising data to monitor whether those changes are moving the needle. This kind of competitive benchmarking is not about copying others, but about identifying best practices, avoiding blind spots, and using data to inform strategic improvements.
By keeping an eye on your category and continuously comparing your listings against top performers, you create a feedback loop that sharpens your competitive edge and improves your chances of dominating both search visibility and conversion performance.
Tracking Long-Term Trends and Making Data-Driven Adjustments
Evaluating your Amazon listings is not a one-time task. Conversion performance changes over time based on many internal and external variables. These include seasonal shifts, algorithm updates, review trends, competitive pressure, advertising performance, and even customer sentiment. To stay ahead and improve your listing health consistently, you need to monitor long-term trends and make informed adjustments based on actual performance data.
Start by building a tracking system outside of Seller Central. While Amazon provides access to business reports and advertising metrics, these platforms have limited historical visibility. Unless you are manually exporting data, much of your past performance becomes difficult to retrieve over time. A simple spreadsheet or dashboard that tracks your key metrics weekly or monthly will give you greater control. Focus on tracking Unit Session Percentage, Sessions, Page Views, Total Order Items, ACoS, and Conversion Rate from ads.
Review this data across a rolling period, such as the past three, six, or twelve months. If your Unit Session Percentage is slowly declining, it is a signal that something on your listing or in your category is changing. A drop might be caused by a wave of new competitors, a decline in review quality, or buyer expectations shifting due to price changes or trends. A gradual increase in conversion is equally valuable to study. You want to identify what changes you made that may have contributed to better performance, so you can replicate that success across other listings.
Segment your products by category, performance tier, or product age. For example, track how your newly launched items compare to mature listings that have accumulated reviews and brand visibility. A new product may have a strong CTR due to novelty but may convert poorly if it lacks reviews or detailed content. By contrast, your bestsellers may show stable conversion but be under threat if new listings with stronger value propositions enter the market.
Do not overlook seasonality. Some products convert better in Q4, others peak during spring or back-to-school season. Compare year-over-year data to identify patterns. If your gardening tools consistently convert at 17 percent in March and dip to 9 percent in November, that is a natural seasonal curve, not necessarily a listing problem. Recognizing these cycles helps you avoid reacting emotionally to short-term fluctuations and allows you to time promotional or optimization efforts more effectively.
Use change logs to track what you modify in your listings. If you update images, change bullet points, adjust pricing, or launch a new ad campaign, make note of the date and the specific action taken. When you look back at your performance data, these notes provide context. You can then attribute a drop or lift in conversion to actual decisions, not guesswork. Over time, this builds a repository of learning that allows you to scale your catalog with more predictability.
Combine this listing data with customer feedback from reviews, messages, and returns. If you notice common complaints about packaging, missing parts, or product quality, these issues often affect conversion before they even lead to a negative review. Customers who are disappointed tend not to buy again, and word of mouth can slowly erode trust. Incorporating qualitative feedback into your long-term analysis keeps you focused on the full customer journey, not just surface-level metrics.
In the end, optimizing your Amazon conversion rate is not about quick fixes. It is about creating a system that lets you react to performance shifts with confidence, measure the impact of changes, and apply what you learn to future listings. When you make data-backed adjustments consistently, you build resilience into your product strategy and create a competitive edge that is hard to replicate.
Common Mistakes That Hurt Your Amazon Conversion Rate
Even experienced sellers can fall into traps that negatively impact their Amazon conversion rates. Many of these mistakes are subtle, not immediately obvious in metrics, and often go unnoticed until sales begin to drop or advertising costs rise with little return. To maintain strong performance, it is essential to recognize these pitfalls and proactively avoid them.
One of the most common errors is neglecting listing quality after launch. Sellers often spend time perfecting their product pages at launch, then fail to revisit them once the product is live. Over time, customer expectations evolve, competitors improve their content, and market dynamics shift. A listing that was effective six months ago may now be outdated, missing key search terms, or lacking persuasive imagery compared to new entries in the same category.
Another major mistake is relying on keyword stuffing rather than writing for clarity and persuasion. While SEO is important, filling titles and bullet points with poorly placed keywords makes listings hard to read. Shoppers want quick, scannable information that explains what the product is, why it is valuable, and whether it meets their needs. Excessive repetition or awkward phrasing erodes trust and can lead to high bounce rates, especially on mobile devices where space is limited.
Many sellers also overlook the importance of mobile optimization. More than half of Amazon customers browse and purchase through the mobile app. If your images contain small text, or your bullet points are too long and difficult to scan, you are missing the opportunity to convert a large portion of your traffic. Check your listings regularly on a mobile device to ensure they are visually effective and easy to engage with on a smaller screen.
Poor image strategy is another frequent issue. Some sellers rely on one or two photos that barely meet Amazon’s basic requirements. This leaves customers guessing about features, sizing, and use cases. A listing with only static studio shots cannot compete with one that includes lifestyle imagery, infographics, and close-up details. Shoppers rely on visuals to make decisions quickly, and weak images significantly reduce conversion, especially in saturated markets.
Failing to address negative reviews or unanswered questions also hurts conversion. Customers read both recent reviews and the Q&A section to validate their choices. If there are complaints about missing parts, poor instructions, or quality concerns, and the seller never responds or makes changes, this damages trust. It signals that the seller is not engaged or unwilling to improve. Proactively managing feedback and making meaningful updates to your product or listing helps reinforce credibility.
Another costly mistake is not monitoring your Buy Box ownership. Sellers sometimes assume they are winning the Buy Box when they are not. If you lose the Buy Box due to price fluctuations, backorders, or poor account health, your listing may still receive traffic, but conversions drop because the sale is going to another seller. Always monitor your Buy Box percentage and take action quickly when it drops.
Lastly, some sellers depend too heavily on ads to compensate for low conversion. Running aggressive Sponsored Product campaigns without addressing weak listings creates a cycle of wasted spend. If your product page does not convert well, increasing traffic will only make the inefficiencies more expensive. Ads should amplify a well-optimized listing, not cover for its weaknesses.
In summary, many of the biggest threats to conversion are preventable. They come from neglect, poor communication, or misunderstanding what customers need to feel confident in a purchase. By avoiding these mistakes and continuously refining your listings with a customer-first mindset, you create a stronger foundation for lasting performance on Amazon.
Building a Conversion Optimization Workflow: Test, Measure, Repeat
Improving your Amazon conversion rate is not about making one-time fixes. It requires a structured, ongoing workflow that allows you to identify weaknesses, implement changes, and measure outcomes with consistency. Sellers who treat optimization as a repeatable process, rather than an occasional task, are more likely to outperform competitors and sustain profitability over time.
The foundation of this process is testing. Without testing, every change becomes a guess. Amazon does not allow traditional A/B testing on standard listings unless you are enrolled in Brand Registry, which grants access to the Manage Your Experiments tool. If you have access, this feature lets you run experiments on A+ Content, product titles, and images. For example, you can test two versions of your main image over a set time period and see which one leads to better conversion. This type of direct experimentation helps you make data-informed decisions instead of relying on assumptions or design trends.
If you are not eligible for Manage Your Experiments, you can still run manual tests. Change only one element at a time, such as a main image or set of bullet points, and track performance over the next two to four weeks. Focus on Unit Session Percentage and ad conversion rate. Avoid making multiple changes at once, since this can blur the impact and make it harder to know what actually worked. Consistency and patience are important. You need enough data to draw meaningful conclusions.
Measurement is the next critical step. Regularly export reports from Seller Central and your ad console to document your key performance indicators. Keep a log of when changes were made and what was adjusted. This will allow you to create a timeline of improvements and understand which updates led to real gains. Use visual dashboards or even basic spreadsheets to track performance across different SKUs, especially if you manage a large catalog.
To add further precision, combine listing performance data with customer behavior signals. Read recent reviews, answer customer questions, and monitor return reasons. These inputs provide a layer of qualitative feedback that numbers alone cannot offer. For example, if your updated bullet points result in fewer questions about sizing, that is a positive outcome even if your Unit Session Percentage only moves slightly. Many small improvements compound over time and improve customer satisfaction in parallel with conversion rates.
Once you have tested and measured, the final step is to repeat the process. Optimization is not a project with a fixed endpoint. Competitors are evolving, customer expectations are shifting, and new tools or features may become available on the platform. This means your listings must adapt continuously. Build a schedule for revisiting each product page, especially your top sellers and ad-driven SKUs. Even a quarterly review cycle can catch issues before they become costly.
This workflow becomes even more powerful when shared across your team. If you operate as part of a brand or agency, create standardized documentation for testing protocols, result tracking, and listing updates. This improves operational efficiency and makes it easier to scale what works across multiple products or clients.
In conclusion, building a conversion optimization workflow ensures your listings stay competitive and effective over time. It reduces guesswork, increases revenue efficiency, and helps you grow your Amazon business with greater confidence. By adopting a process built on testing, measurement, and iteration, you create a foundation for long-term success in a constantly changing marketplace.
Research Citations
- Amazon. (n.d.). Manage Your Experiments.
- Amazon. (n.d.). Detail Page Sales and Traffic by Child Item.
- Amazon Advertising. (n.d.). Advertising metrics definitions.
- Jungle Scout. (2023). Amazon conversion rate: What sellers need to know.
- Sellics. (2022). Amazon benchmark report: Average conversion rates and performance by category.
- Tinuiti. (2024). Amazon listing optimization: A complete guide.
- Webretailer. (2023). How to analyze your Amazon business reports for better performance.
- DataHawk. (2023). The importance of Buy Box ownership for conversion rates.
- CPC Strategy. (2021). Amazon SEO and conversion rate best practices.
- BigCommerce. (2024). How to boost your Amazon sales through better listing performance.
FAQs
A good conversion rate on Amazon, measured by Unit Session Percentage, typically ranges between 10 percent and 15 percent. However, this can vary significantly depending on the product category, price point, and competition. Low-ticket, high-demand items may convert at over 20 percent, while high-priced or complex products may still perform well with a conversion rate around 5 percent to 10 percent. Always compare your listings against category-specific benchmarks and track your own historical performance.
Log in to Seller Central, navigate to the “Reports” tab, and select “Business Reports.” From there, open “Detail Page Sales and Traffic by Child Item.” The column labeled “Unit Session Percentage” shows your conversion rate for each product. Make sure to adjust the date range to reflect enough data, such as 30 or 90 days, for meaningful analysis.
Yes, images play a major role in influencing buyer decisions. Your main image must stand out in search results, while your secondary images should demonstrate product features, dimensions, and usage. Including lifestyle photos and infographics can significantly improve clarity and trust, which often leads to higher conversion rates.
You should review your listings at least once per quarter, especially for bestsellers and ad-supported products. Product categories that experience seasonal changes or rapid competition may require monthly updates. Track conversion metrics and customer feedback to determine when adjustments are needed.
Several factors can contribute to this mismatch. Common issues include poor images, unclear or generic copy, weak review history, pricing that is not competitive, or a mismatch between search intent and listing content. If you are running ads, you may also be attracting unqualified traffic through broad or irrelevant keywords.
Absolutely. If you do not win the Buy Box, customers are less likely to complete the purchase from your listing, even if they land on your page. Your Unit Session Percentage may appear artificially low if another seller is capturing the sale. Always monitor your Buy Box percentage alongside your conversion rate.
Yes. A+ Content helps communicate your value proposition with enhanced images, comparison charts, and structured storytelling. When done well, it increases buyer confidence and reduces objections. This can lead to a measurable increase in conversion, especially for new-to-brand customers who are unfamiliar with your product.
Is there a way to test listing changes scientifically?
If your brand is registered with Amazon, you can use the “Manage Your Experiments” tool to A/B test images, titles, and A+ Content. If you are not eligible, run manual tests by changing one element at a time and measuring performance over two to four weeks. Keep detailed logs to isolate which changes drive improvements.
Look for trends such as a declining Unit Session Percentage, a drop in average star rating, an increase in customer questions or negative reviews, or high ad spend with low return. These signals suggest friction points in your product page that may be preventing customers from purchasing.
Customer reviews, Q&A responses, and return reasons contain valuable insights into what matters most to buyers. If reviews mention confusion about product use or sizing, update your images or bullet points to address those issues. If returns spike after a listing change, consider reversing it. Direct feedback from real users often reveals gaps that metrics alone cannot.